Why do crypto prices go up and down so fast? Many traders struggle to understand these sudden movements and miss opportunities or make mistakes.
The market moves based on multiple factors—supply and demand, news, and trader sentiment—all happening in real time. Without the right approach, you can get lost in the noise.
This guide breaks down the simple methods for analyzing crypto price movements so you can make informed decisions and trade with confidence.
What Affects Crypto Price Movements?
Crypto prices don’t move randomly. They are influenced by:
1. Supply and Demand
Just like any market, the price of a cryptocurrency is based on how many people want to buy versus how many want to sell.
A limited supply with increasing demand can lead to higher prices, an oversupply can push prices down.
2. Market Sentiment
News, social media, and investor emotions play a big role in price movements.
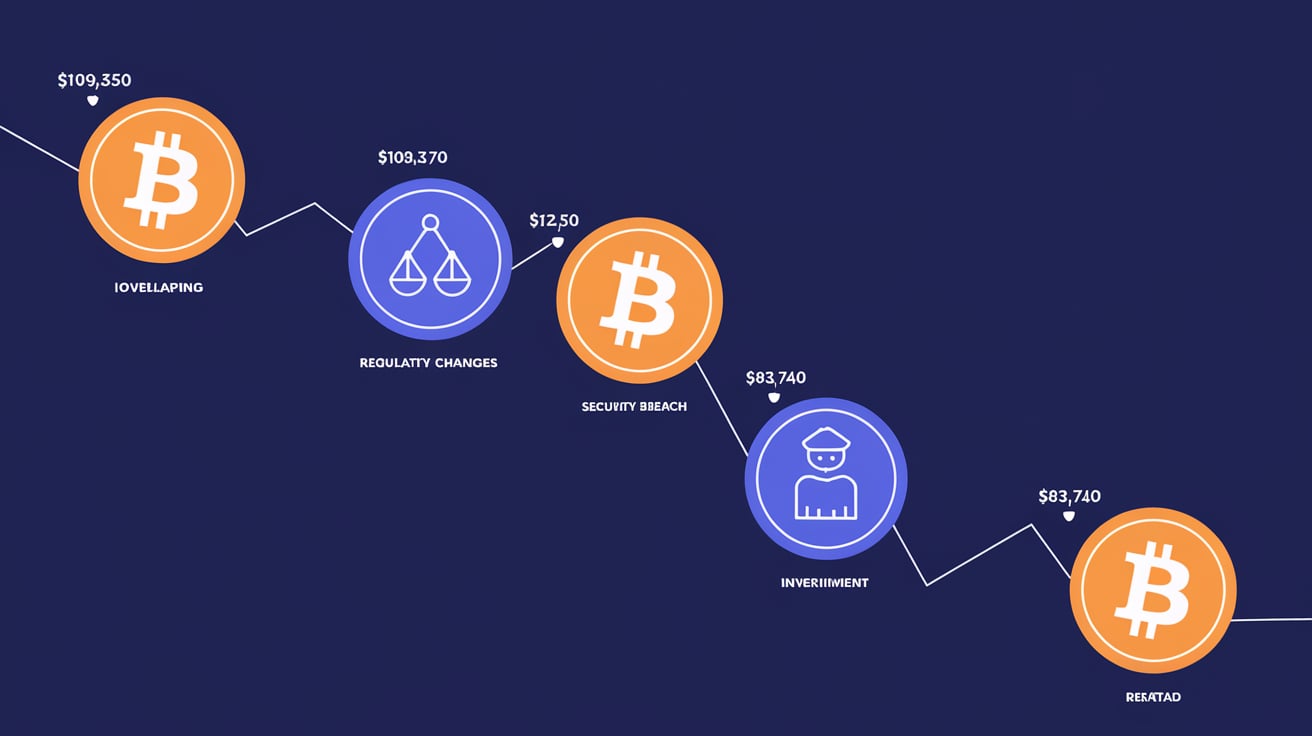
Positive news about regulations, partnerships, or technological advancements can push prices up, and negative news like security breaches or government bans can cause sharp drops.
3. Regulations and Policies
Government decisions on cryptocurrency taxation, trading restrictions, and legal recognition can heavily impact prices.
For example, when China banned crypto transactions the market dropped sharply.
4. Macroeconomic Factors
Global events like inflation, interest rate changes or economic recessions also affect the crypto market.
When traditional financial markets are unstable investors may turn to cryptocurrencies as an alternative asset.
Key Indicators for Crypto Prices
Traders use different indicators to study price movements and predict future trends. These indicators are divided into two main categories:
Technical Indicators
1. Moving Averages (MA)
Moving averages smooth out price data over a period of time making it easier to spot trends.
A short-term moving average crossing above a long-term moving average can signal a price increase.
2. Relative Strength Index (RSI)
RSI measures the strength of recent price movements. A value above 70 means an asset may be overbought, and a value below 30 means it may be oversold.#### 3. MACD (Moving Average Convergence Divergence)
MACD helps traders identify trend reversals by comparing two moving averages.
A positive MACD means upward momentum, and a negative MACD means a downward trend.
4. Bollinger Bands
Bollinger Bands show price volatility by creating an upper and lower range around a moving average.
If the price moves near the upper band it may be overbought, near the lower band it may be oversold.
Fundamental Indicators
1. On-Chain Metrics
Metrics like transaction volume, active addresses, and hash rate provide insights into the overall network activity and health of a cryptocurrency.
2. Market Capitalization
Market cap is calculated by multiplying a coin’s price by its total supply. A higher market cap generally means a more stable asset.
3. Trading Volume
Volume reflects how actively a cryptocurrency is being traded. High volume often means strong interest and liquidity, low volume means weak demand.
Read also
How to Read Crypto Price Charts
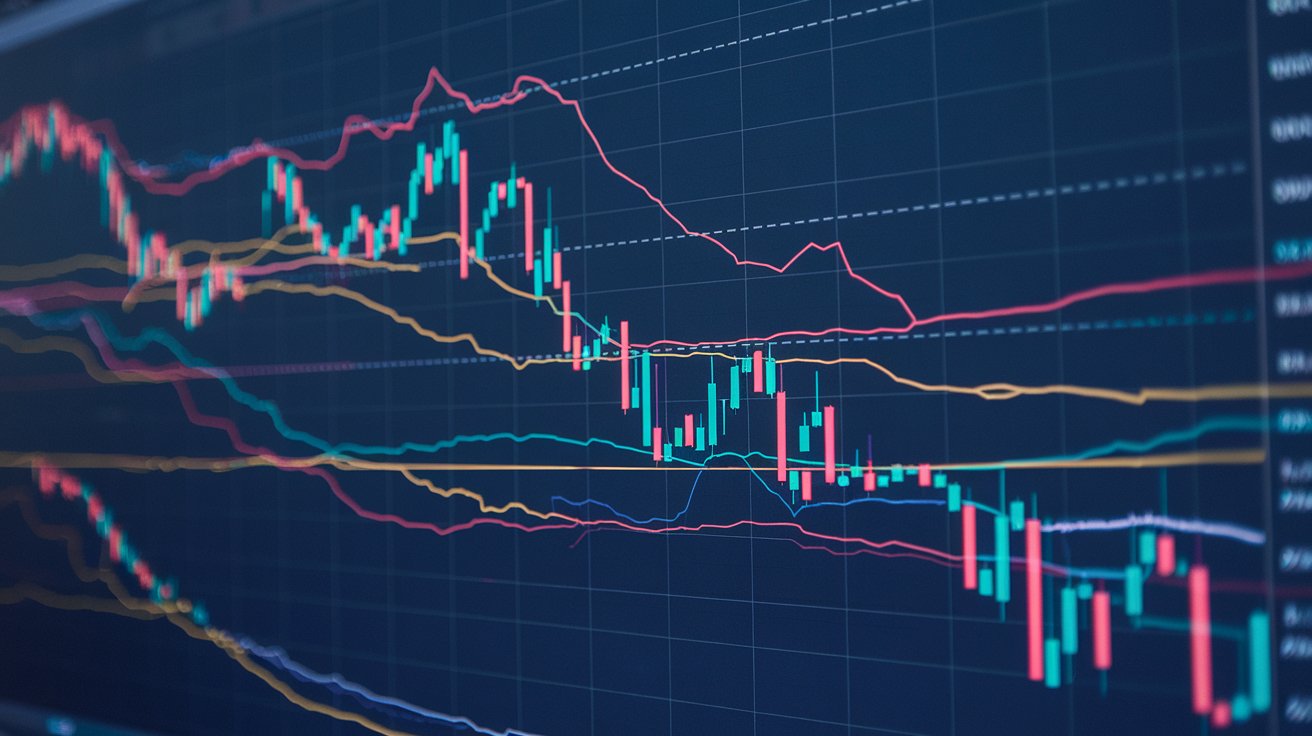
Understanding price charts is a key skill for any trader. The most common chart type is the candlestick chart which provides information about an asset’s open, high, low, and close prices over a specific period.
Different Chart Patterns
- Bullish Patterns: Indicate potential price increases (e.g. ascending triangle, cup, and handle).
- Bearish Patterns: Suggest possible price declines (e.g. descending triangle, head and shoulders).
- Support and Resistance: Support is a price level where demand is strong enough to prevent further declines, and resistance is where selling pressure prevents price increases.
Trend Analysis
- Uptrend: A series of higher highs and higher lows.
- Downtrend: A series of lower highs and lower lows.
- Sideways Trend: Prices move within a range without a clear upward or downward direction.
Using Historical Data to Predict Future Movements
Traders often look at past price movements to make informed predictions. Historical data helps to identify patterns and trends that may repeat in the future.
For example, Bitcoin has shown cycles of rapid growth followed by corrections which some traders use to time their trades.
Common Mistakes Traders Make When Analyzing Crypto Prices
Many traders fall into common traps when analyzing crypto prices. Avoid these mistakes to improve trading outcomes:* Using a single indicator instead of combining multiple analysis tools.
- Ignoring fundamentals like news and market sentiment.
- Making impulsive decisions based on emotions rather than data.
- Overtrading by entering and exiting positions too frequently without a clear strategy.
Tools and Platforms for Crypto Analysis
Several platforms provide valuable insights and tools:
- TradingView: Advanced charting and technical analysis.
- CoinGecko: Market data, coin rankings, and historical trends.
- CoinMarketCap: Real-time prices, market cap,s, and trading volumes.
- Crypto News Aggregators: Stay updated with the latest market news.
Conclusion
Analyzing crypto price movements is a combination of technical and fundamental analysis.
By understanding trends, using indicators, and avoiding common mistakes, you can make better decisions.
Continuous learning and adapting to market changes is key to long-term success in crypto trading.
Continue Reading with Premium Access!
We hope you enjoyed the preview. To read the rest of this article and access all our premium content, please register your account.
Register Now to gain unlimited access to exclusive articles, in-depth analysis, and more.


 Expert Evaluation of Altcoin & Cryptocurrency Market Cap
 Mutuum Finance (MUTM) Price Forecast 2025: Expert Analysis
 Internet Computer (ICP) Price Prediction 2025 | Future Outlook


